The roadmap
Every dollar in a digital marketing budget is doing one of three things: capturing demand that already exists, creating demand that doesn’t yet, or building assets that reduce what you pay for both over time. The healthiest programs invest across all three simultaneously. Most don’t — and that’s why they become more expensive every year for the same results.
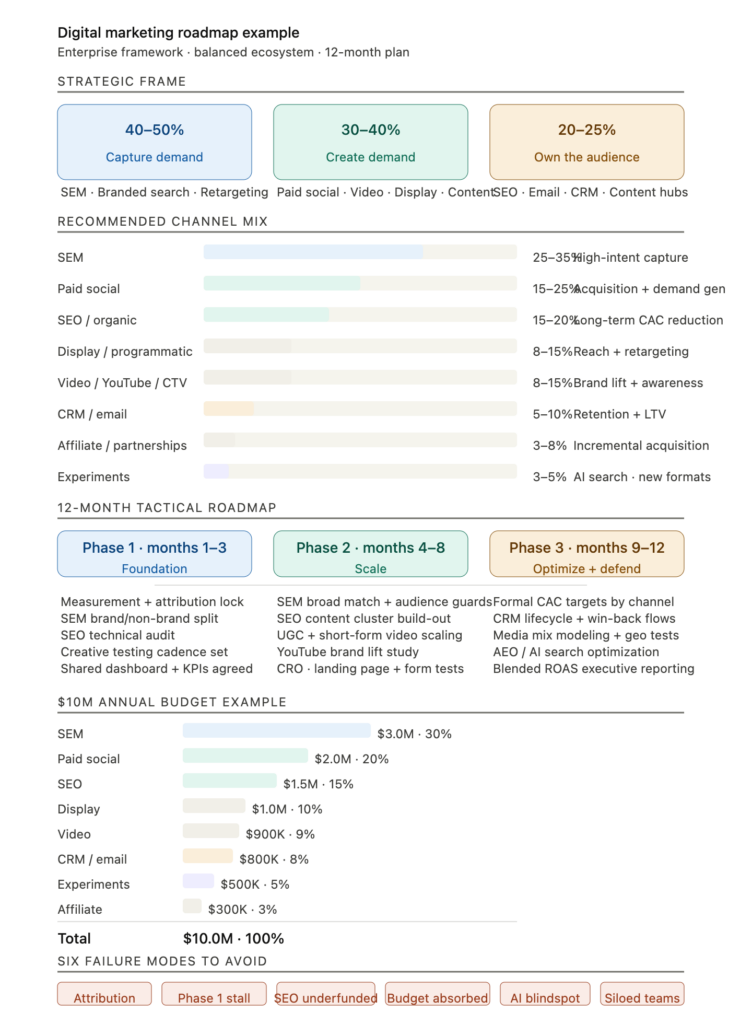
This roadmap is built for enterprise marketing teams that need a defensible, scalable plan across channels, budget, and time. It covers strategic frame, channel mix, a 12-month phased rollout, a worked $10M budget example, the KPI framework, and the six failure modes that quietly kill most programs before Month 9.
The three strategic buckets
Before assigning a dollar to any channel, you need a structure. Everything maps to one of three buckets.
Capture demand (40–50% of total budget) These are channels where users are already looking — your job is to convert them efficiently. SEM, branded search, shopping ads, and retargeting all live here. This bucket delivers near-term revenue predictability. Most programs over-allocate here because it’s the most measurable.
Create demand (30–40% of total budget) Paid social, video, display, influencer, and content marketing. The job is moving people from unaware to considering. This bucket determines mid-term brand growth and future branded search volume. It’s harder to measure, which is why it gets cut first under budget pressure.
Own the audience (20–25% of total budget) SEO, email, CRM, and content hubs. The goal is reducing paid media dependency over 12–24 months — not 3. This is the long-term CAC defensibility play. It is also consistently the most underfunded bucket in large enterprise programs, because it doesn’t produce clean week-over-week numbers.
Recommended channel mix
These ranges reflect what actually works across large B2C and B2B businesses. Your specific allocation should be calibrated to blended CAC targets and incrementality data, not industry benchmarks alone.
| Channel | Budget % | Primary goal |
|---|---|---|
| SEM (non-brand + brand) | 25–35% | High-intent demand capture |
| Paid social | 15–25% | Audience acquisition, retargeting, demand gen |
| SEO / organic search | 15–20% | Long-term traffic, authority, CAC reduction |
| Display / programmatic | 8–15% | Reach, retargeting, assisted conversion |
| Video / YouTube / CTV | 8–15% | Brand lift, engagement |
| CRM / email / lifecycle | 5–10% | Retention, LTV growth, nurture |
| Affiliate / partnerships | 3–8% | Incremental acquisition |
| Experiments / new channels | 3–5% | AI search, creator formats, new platforms |
A note on experiment budgets: This is not a slush fund. Each test needs a pre-written hypothesis, a fixed budget cap ($25–75K range), and a kill-or-scale decision trigger at 60–90 days. Without that structure, the experiment line quietly becomes SEM overage in Q3, with nothing learned.
Allocation by business maturity
The same channels behave differently depending on where a business sits. All rows sum to 100%.
Aggressive growth (market share expansion, high CAC tolerance)
| Channel | % |
|---|---|
| SEM | 30% |
| Paid social | 25% |
| Display / programmatic | 15% |
| SEO | 13% |
| Video / YouTube | 10% |
| Experiments | 5% |
| CRM | 2% |
CRM at 2% is intentional for early-stage — but dangerous if held beyond 18 months. Customers who churn silently erode the retention economics that justify aggressive acquisition spend. Flag this line for reassessment at the 12-month mark.
Mature enterprise brand (efficiency, retention, defensibility)
| Channel | % |
|---|---|
| SEM | 35% |
| SEO | 20% |
| Paid social | 18% |
| Display / programmatic | 10% |
| CRM / lifecycle | 7% |
| Video | 7% |
| Experiments | 3% |
At this stage, SEM increasingly protects the moat rather than expanding it. Branded search volume does heavy lifting, and the investment in SEO reflects that organic channels are now mature enough to justify the 18-month horizon.
E-commerce heavy (transaction volume, shopping efficiency)
| Channel | % |
|---|---|
| SEM / Shopping | 40% |
| Paid social | 20% |
| SEO | 13% |
| CRM / email | 10% |
| Display / retargeting | 9% |
| Video | 5% |
| Experiments | 3% |
Email is a profitability channel here, not just a nurture tool. It should carry a revenue target — typically 15–20% of total revenue — not just an engagement metric.
12-month tactical roadmap
What happens in each phase is realistic if teams are properly resourced. If they’re not, compress Phase 1 — do not try to run all tracks simultaneously.
Phase 1 — Foundation (months 1–3)
The objective is clean measurement infrastructure and baseline execution across every channel. Nothing else matters until data is reliable.
- Audit GA4 and fix data gaps before anything else
- Set up Conversion API on Meta and TikTok
- Agree on one attribution model — lock it and enforce it, even if imperfect
- SEM: separate branded and non-branded from day one, with different CPA targets
- SEO: technical audit and crawl blocker fixes
- Paid social: establish a creative testing cadence
- Build a single shared dashboard with agreed KPIs across all channel teams
Phase 1 is almost always underestimated. Clean measurement infrastructure with engineering dependencies takes 6–10 weeks. If attribution is still unresolved at Month 3, do not advance to scaling spend. Bad data at scale is expensive — you optimize toward the wrong thing with more money.
Phase 2 — Scale (months 4–8)
With measurement in place, expand what’s working and begin building the owned-channel base.
- SEM: broad match scaling with audience layering as the safety guard
- SEO: begin content cluster build-out (expect traffic movement in months 10–14, not months 4–8)
- Paid social: UGC expansion and short-form video as the primary creative format
- YouTube: run a brand lift study to quantify upper-funnel contribution — do not measure this on direct ROAS
- CRO: landing page testing and form friction reduction
- First incrementality test on one channel to begin calibrating what attribution is actually telling you
Phase 3 — Optimize and defend (months 9–12)
The objective shifts from growth to defensibility: lower CAC, improve LTV, reduce paid media dependency, and build reporting that a CFO will trust.
- Set formal CAC targets by channel and hold teams accountable to them
- CRM: build lifecycle automation — welcome series, post-purchase, win-back, browse abandonment
- Media mix modeling: geo holdout testing and budget elasticity analysis
- SEO: AEO and AI search optimization — SGE and AI Overviews are reducing click-through on informational queries and it needs to be in the plan
- Affiliate: launch only after attribution is stable; commission-based programs amplify attribution errors
- Executive reporting: blended ROAS, incremental revenue contribution, and CAC:LTV ratio — not individual channel metrics
$10M annual budget example
Modeled on a mature B2C brand with established demand and a 3-year customer LTV above $800. Every line includes a rationale — because every line should be defensible to finance.
| Channel | Allocation | % | Rationale |
|---|---|---|---|
| SEM | $3.0M | 30% | Strong branded search; non-brand drives 60% of pipeline |
| Paid social | $2.0M | 20% | Meta + TikTok; primary new customer acquisition channel |
| SEO | $1.5M | 15% | Content + technical + link acquisition; 18-month CAC payback horizon |
| Display / programmatic | $1.0M | 10% | Retargeting + prospecting; incrementality-tested quarterly |
| Video / YouTube | $900K | 9% | Upper-funnel; measured via brand lift, not direct ROAS |
| CRM / lifecycle | $800K | 8% | Platform + agency fees; email carries a 15–20% revenue target |
| Experiments | $500K | 5% | 4–6 structured tests per year with kill/scale decision triggers |
| Affiliate | $300K | 3% | Commission-based; added only after attribution model is stable |
| Total | $10.0M | 100% | Reviewed quarterly against blended CAC and LTV data |
SEO is shown at $1.5M rather than the commonly cited $1.7M. The $200K difference is reallocated to CRM — email and lifecycle consistently return 30–40x on incremental spend and are the most underinvested channel in this model. Adjust based on your own retention economics.
KPI framework
The fastest way to destroy a marketing organization is to let each channel team optimize its own reported ROAS with no shared source of truth. KPIs must span the full funnel and tie back to business outcomes.
| Funnel stage | Primary KPIs |
|---|---|
| Awareness | Reach, CPM, video completion rate, brand search lift (geo holdout) |
| Consideration | CTR, engagement rate, time on site, assisted conversions |
| Conversion | CPA, ROAS, CVR, pipeline created, revenue |
| Retention | Repeat purchase rate, LTV, churn rate, email revenue share |
| Organic growth | Non-brand traffic, keyword rankings, share of search, organic CVR |
| Efficiency | Blended CAC, blended ROAS, incremental revenue, CAC:LTV ratio |
Add share of AI-cited results as an SEO KPI now. Google’s AI Overviews are reducing organic click-through on high-volume informational queries. If it’s not tracked, the decline gets misattributed to seasonality until the damage is structural.
Channel principles
These don’t change with platform updates. They reflect how each channel actually creates value.
SEM: Separate branded and non-branded from day one — different CPA targets, different bidding strategies, different reporting. Branded search is margin protection. Non-branded is acquisition. Conflating them overstates performance and hides real cost.
SEO: Topical authority compounds. A cluster of 30 deeply connected articles on one subject consistently outperforms 30 standalone posts. Budget on an 18-month horizon. If leadership evaluates SEO quarterly, educate them on the compounding curve before the program starts — not at the Month 6 review when there is nothing to show yet.
Paid social: Creative is the targeting. On Meta in 2025, the algorithm finds the audience — your job is to give it 10 or more creative variants and let it optimize. A single winning creative typically runs 4–6 weeks before fatigue sets in. Production cadence matters as much as media spend.
Display / programmatic: Primary use case is retargeting and assisted conversion, not prospecting. Run incrementality tests before scaling prospecting budgets. Most programs find display prospecting contributes less than reported last-click attribution suggests.
Video / YouTube / CTV: Strong for awareness and demand creation. Do not measure on direct ROAS. Use brand lift studies and branded search volume lift as proxies. Best when paired with retargeting to capture intent from users who engaged but did not convert.
CRM / email: The most underinvested channel in most enterprise plans. A mature email program — welcome, post-purchase, win-back, browse abandonment — routinely contributes 20–30% of total revenue at a fraction of the media cost. If you are spending under 7% here, review retention economics before adjusting any other channel.
Where programs actually fail
These are not theoretical risks. They appear in nearly every large program audit.
| Failure mode | What it looks like | Fix |
|---|---|---|
| Attribution never resolved | Teams optimize to their own channel’s ROAS. No agreement on source of truth. Finance trusts neither number. | Lock one attribution model in Month 1. Enforce it even when imperfect. An agreed 80% model beats a perfect one nobody uses. |
| Phase 1 extended indefinitely | “Still building measurement” at Month 6. No budget has shifted. Same campaigns running as before the roadmap started. | Set hard transition dates. Accept 80% measurement accuracy and move. |
| SEO treated as free | Underfunded, no dedicated resources, results expected in 90 days. The team is asked to “write some blog posts” alongside three other priorities. | Budget for an 18-month content investment. Hire dedicated resources. Results are non-linear — nothing for 6 months, then compounding. |
| Experiment budget absorbed | The $500K experiments line becomes SEM overage in Q3 when CPCs spike. No tests ran. Nothing learned. | Ring-fence with written test plans before the fiscal year starts. No plan, no budget. |
| AI search blindspot | SGE is eroding organic CTR on informational queries. It is not tracked. The decline is attributed to seasonality. | Add share of AI-cited results as an SEO KPI in Phase 3. Begin AEO optimization before the decline becomes structural. |
| Channels don’t share data | Paid social doesn’t know which SEM audiences are converting. SEM doesn’t know which social creatives drove branded searches. No feedback loop. | Monthly cross-channel syncs with shared audience data and conversion signals, built into the governance structure from Month 1. |
The long-term picture
The healthiest enterprise marketing programs evolve toward 40–50% demand capture, 30–40% demand creation, and 20–25% owned growth assets. That ratio creates near-term revenue predictability, mid-term brand growth, and long-term CAC reduction.
A balanced digital ecosystem consistently outperforms over-reliance on any single channel. The programs that fail are not usually wrong about their best channel — they are wrong about ignoring the others.